I can’t believe it took me so long to think of this! In this post I’ll share a new Excel template I created to help calculate your SGP factors (or SGP denominators).
One of the very first posts I wrote on this site was about “Calculating What it Takes to Win Your League”. I’ve then gone on to write many articles about standings gain points and even about an improvement in the process I found by reading Art McGee’s book “How to Value Players for Rotisserie Baseball” (It’s quite expensive at Amazon but Baseball HQ has had it on “Inventory Closeout” for quite a long time).
So after a few years of writing about SGP it finally dawned on me that, “I should create an Excel file that wraps all this together.” So that’s what I’ve tried to do. The “SGP Calculator” asks a few simple setup questions about your league, the amount of history you want to use, and then uses the SLOPE formula to calculate the standings gain points for each of your league’s scoring categories.
Here’s How the “SGP Calculator” Works
The first tab is aptly named “ANSWER THESE QUESTIONS FIRST”. Several of these are very important in determining how the slope calculations are made so don’t skip over this.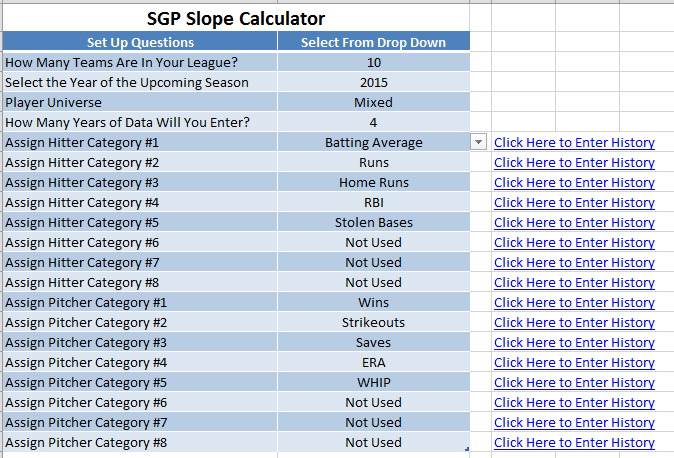
The Excel file can accommodate up to eight different hitting and pitching categories, up to 10 years of standings information, and up to 15 teams. Use the drop down menus on this tab to select your league’s setting.
The next tab in the spreadsheet is “SGP CALCULATIONS”. Let’s skip over that for now and circle back to it.

The yellow colored tabs are where you will enter your league history of the overall standings and the totals in each individual category. There are tabs for “Historical Final Standings” (where you’ll enter the total ending roto points for each team), “Hitter Stats”, and “Pitcher Stats”.

There are 17 yellow tabs. One for overall standings and then eight each for hitting and pitching categories.
Each yellow tab displays the “Category Name” in the top left (see “Batting Average” example below). You can enter the history for that category in the table below. Because the spreadsheet has been set up to accommodate 15 teams and 10 years of history you may see several rows and columns with labels “DO NOT ENTER DATA”. Just ignore those rows and columns and only enter data for the years and number of teams you have selected.
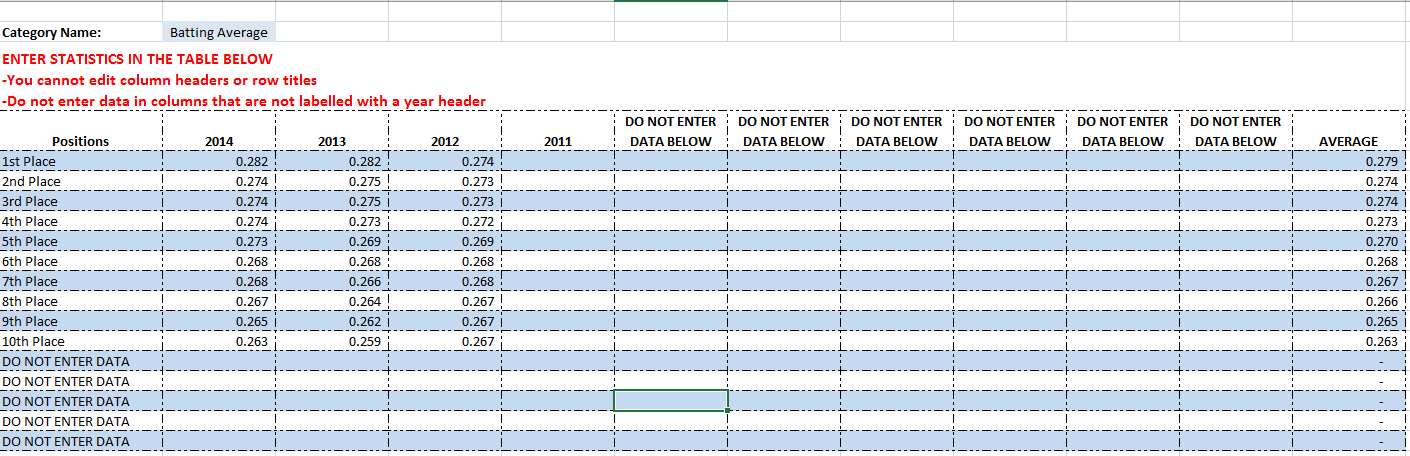
The image is large but I had to shrink it to fit here. Click the image to see the full version.
Now we can return to the “SGP CALCULATIONS” tab, the end result. It displays the average statistics for each scoring category and uses Excel’s SLOPE formula to calculate the SGP factor (denominator) for each category.
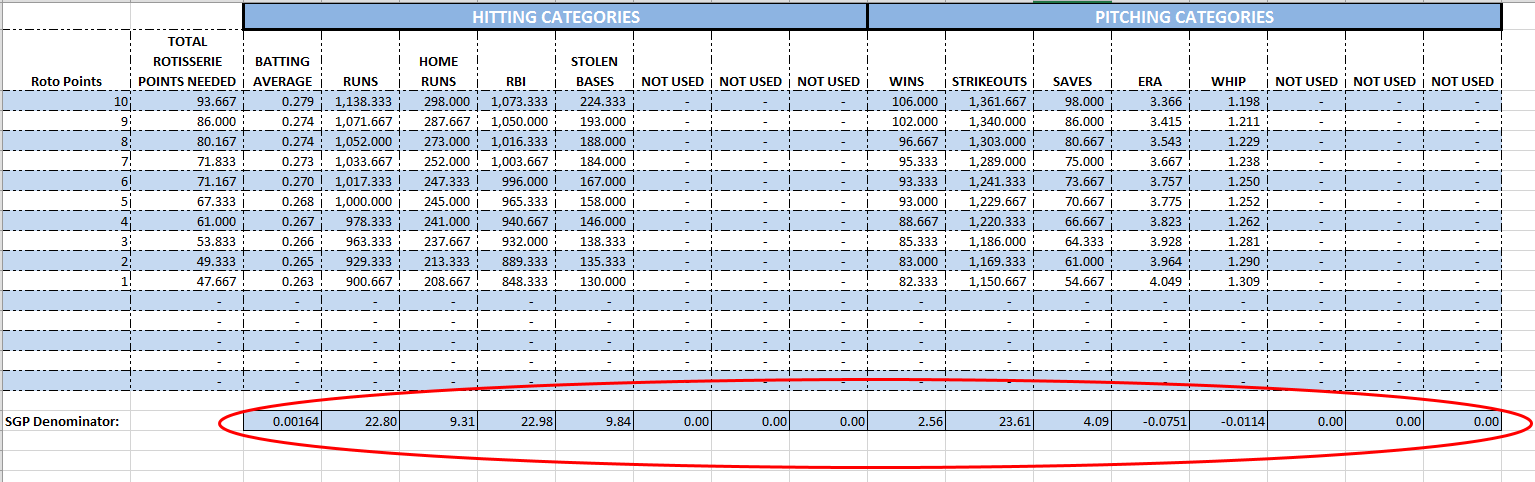
Click the image to see the full-sized version.
These are the same SGP factors you would then plug into your customized rankings.
Download the File
You can download the file using this link: SGP Slope Calculator Spreadsheet.xlsx
Or check it out at the Smart Fantasy Baseball Tools page with the Player ID Map (and hopefully some additional tools in the future).